In the PQ-MSA + application, the statistics are grouped into 4 categories:
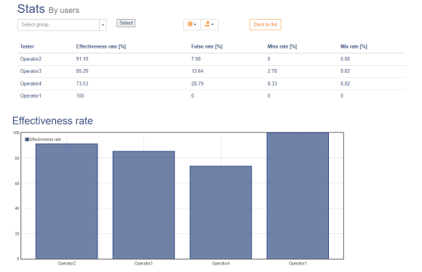
- Statistics divided into controllers – statistics in which we can find indicators such as:
- success rate (number of correct answers)
- Miss rate (number of non-compliant products assessed by the inspectors as compliant)
- False rate (number of compliant products assessed as defective by the inspectors)
- Mix rate (number of inconsistent assessments – the inspector once assessed the product as compliant and once as non-compliant)
- Individual statistics – in which there are answers of individual controllers with highlighted incorrect answers.
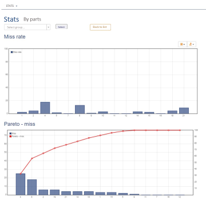
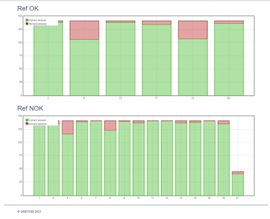
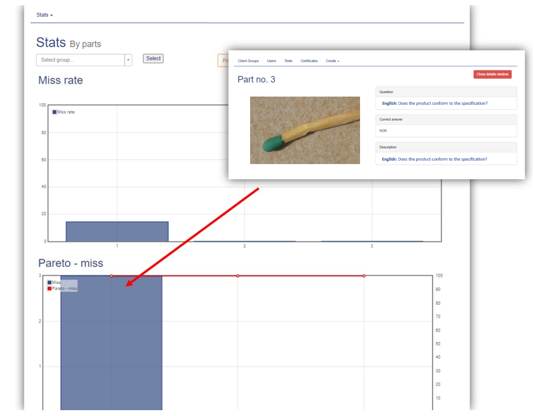
- Statistics for the product – statistics illustrating the test results from the product side. They allow, among others to judge which photos caused the raters the most problems. The following statistics are available here:
- success rate
- Miss rate
- False rate
- Mix rate
- Pareto charts for all the above statistics.
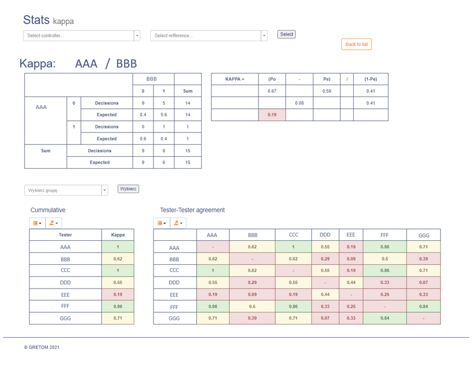
- KAPPA – statistics enabling the assessment of compliance of the assessment between individual controllers, as well as between the controller and the reference value.
We can analyze the collected statistics with a division into created groups (e.g. controllers from various shifts, departments or suppliers).
All charts are active – after clicking, it is possible to check precisely which product the given statistics applies to. You can export all results to Excel and perform additional analyzes.